
December 13, 2023
Dashboard series: Addressing Exec Leadership Cyber Risk Questions with Balbix

Anuj Magazine
5 min read | Cyber Risk Quantification
December 13, 2023
One common pain point we hear from our Fortune 1000 customers, like the following from a CISO at a major US-based telecommunications company, is quite revealing-
“Now we’ve got activities coming from Leadership, legal, the board of directors, all sorts of people calling and saying, ‘Hey, what’s our cybersecurity posture, our readiness, and what are the metrics?'”
These questions have become more pronounced in recent conversations, especially following the SEC’s final rule. CISOs want to tell the board and leadership the truth, good or bad.
Executive leaders are no longer content with high-level risk statuses; they require more detailed data and metrics. In a typical Fortune 1000 company, different business units often tend to have varied, fragmented cybersecurity processes like asset management and vulnerability management, which result in different ways of measuring risk. Thus, it’s challenging to identify which units pose the most significant risks and pinpoint reports needing immediate attention.
Typically, creating such comprehensive reports involves extensive data crunching through complex spreadsheets.
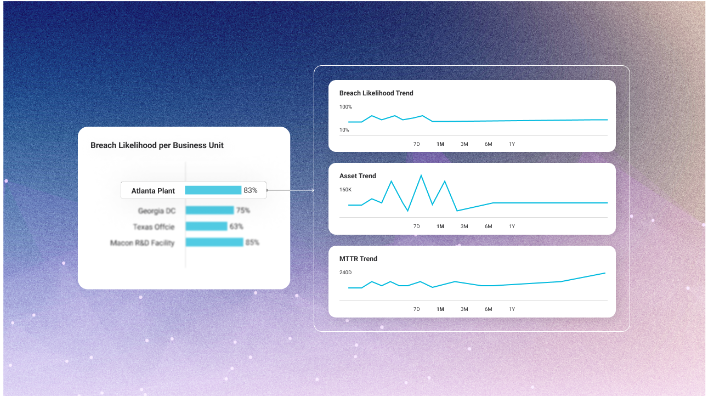
Balbix provides executive leaders with native and configurable dashboards that address these critical cyber risk questions, offering clarity and direction to make more informed decisions.
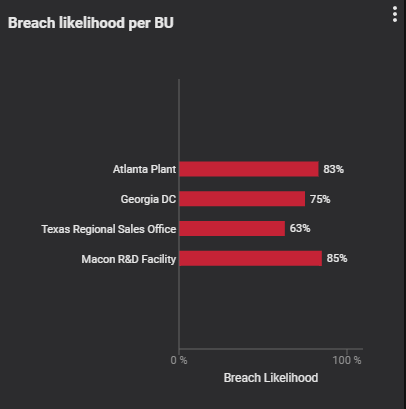
Question: Which BUs contribute the most to our organization’s overall cyber risk?
Our customers leverage a chart below that breaks down the breach likelihood by business unit, expressed as a percentage. Such a granular view provides executive leadership visibility into which business units contribute the most to the organization’s overall cyber risk.
With Balbix, you can also view risk across your organization by geography, site, asset type, and business owner. Moreover, you can drill down to inspect the underlying assets, vulnerabilities, and mitigating controls contributing to the risk assessment.
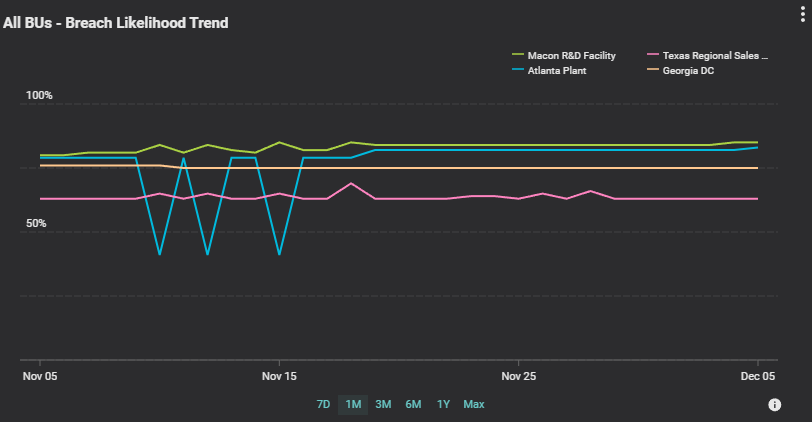
Question: How have our Business Units (BUs) evolved in managing cyber risk, and what lessons can we learn from the most successful BUs?
Many of our customers leverage the widget below to monitor the breach likelihood trends across timelines such as seven days, one month, three months, six months, and one year. By tracking these trends, executive leadership can identify best practices and areas for improvement in managing cyber risk across the organization.
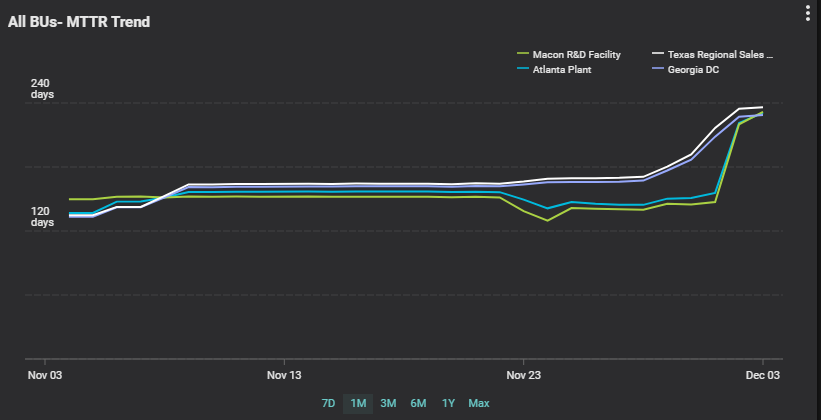
Question: Which BUs are most efficient in resolving vulnerabilities, and where must we improve our response strategies?
Our customers monitor Mean Time to Resolve (MTTR) trends for vulnerabilities over time, broken down by BU. This view helps CISOs to identify and prioritize areas needing immediate attention and allocate resources more effectively. It also provides insights into the efficiency of vulnerability management processes in different BUs.
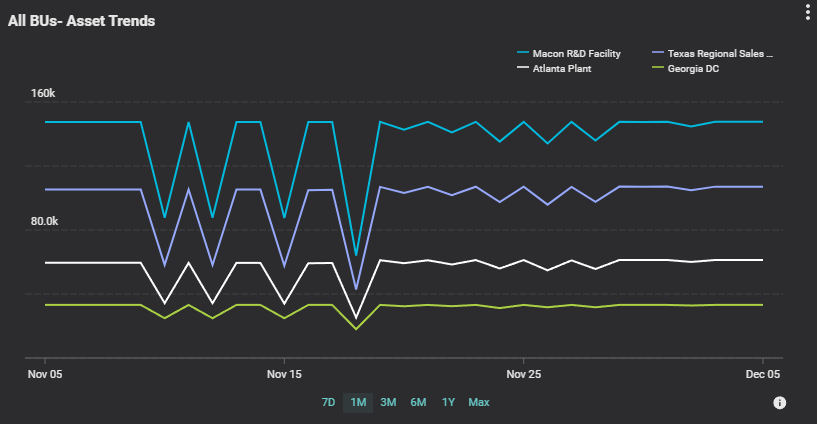
Question: How does the change in the number of assets impact our vulnerability resolution rate, and what does this indicate about our overall security posture?
In F1000 organizations with thousands of assets, the asset inventory is dynamic, with assets regularly entering and leaving the network. Our customers leverage the trend view below to understand the asset landscape across BUs over time. When integrated with vulnerability burn-down trends, this view helps analyze whether an increase or decrease in assets positively or negatively affects the rate of vulnerability resolution.
By providing a clear, quantifiable overview of cyber risk across different dimensions, these dashboards empower executive leaders with the insights needed to make strategic decisions, ensuring a robust and responsive cybersecurity posture.