

December 3, 2023
Flying Blind: Is your Vulnerability Management program working?

Mike Parkin
9 min read | Vulnerability Management
December 3, 2023
Vulnerability management is a non-trivial problem for any organization that is trying to keep their environment safe. There can be myriad tools in use, multiple processes, regulations, and numerous stakeholders all putting demands on the program. All of these factors can combine to make it difficult to see how effective the process is in practice.
The good thing is that most tools can deliver metrics that reflect how their individual part of the stack is working. Whether it’s security tools, asset managers, or software analysis tools, each typically provides useful metrics. While deriving metrics from home-grown tools and processes can be more of a challenge, analysts can usually figure out what they need to know from the data they have.
The real challenge is figuring out exactly which metrics are important to getting the clearest picture of the vulnerability management program’s efficacy, and which ones are less important to seeing the big picture. Not to say that those other metrics aren’t important. But in this context, some are much more useful than others.
To get a clearer picture of what metrics are most useful in practice, we went to our customers to find which ones they relied on. Here, based on conversations our Customer Success team has had with customers, we can deliver some insights on their real-world uses – not just our own opinions.
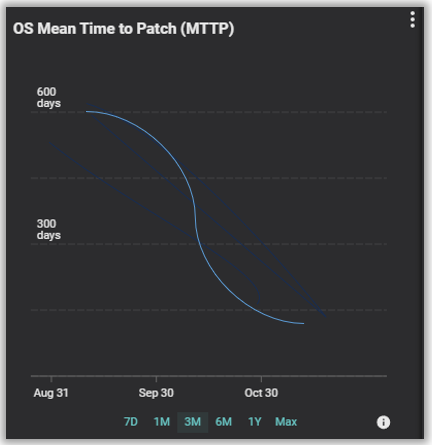
Several Balbix customers have relayed that they focus heavily on tracking how their patching process is performing. While different customers have different preferences on dashboard layouts and which specific metrics they display, the two most common metrics are Mean Time To Patch (MTTP) and how closely they’re meeting their Patch Service Level Agreement (Patch SLA).
These two metrics are closely related, with MTTP being how long it takes between a “you need to patch this” coming up, and the patch actually being deployed. Most organizations will use the “Patch Available” date to start the clock, though some can be very aggressive and use the CVE release date as their starting point. Patch availability date is the start point Balbix uses in our own calculations.
Patch SLA, on the other hand, measures how often patches are deployed within the timeframe set by the SLA. The SLA for individual patches can vary considerably depending on how serious the issue is being addressed. Critical security patches, for example, need to be patched as quickly as practical, while simple feature updates can easily wait until the next maintenance cycle without risk.
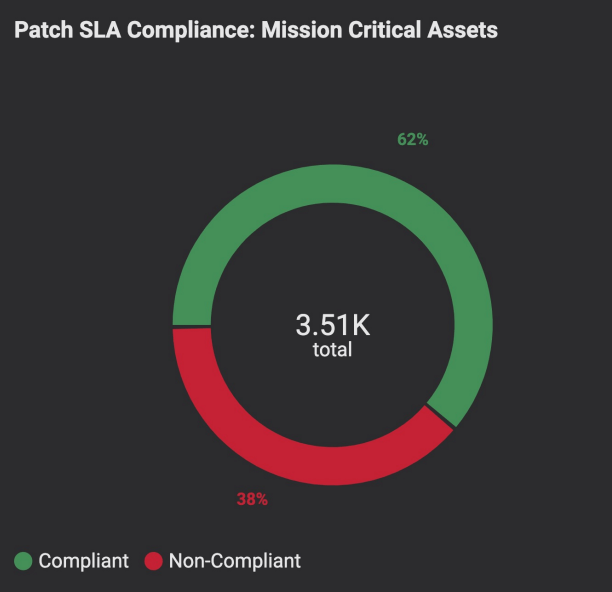
That latter aspect is vital, and being able to separate the Patch SLA metric based on severity is an important factor in monitoring and tracking performance.
Tracking the delta in these two related metrics can give insights into how the vulnerability management program is performing overall. Ideally, there would be an ongoing downward trend in the mean time-to-patch, with a corresponding upward trend in patches meeting their required SLA.
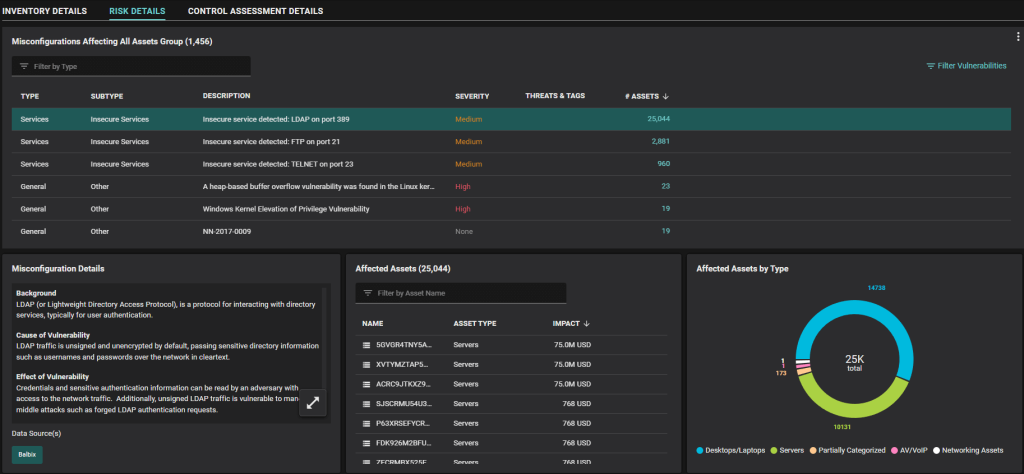
Another metric that our users have found important for measuring their vulnerability management program is the number of misconfigured assets they’ve discovered in the environment. Since misconfigurations can be a major, and often unrecognized, source of risk, it makes sense to keep a careful eye on them across the environment.
As with MTTP, the delta over time is often more important than a point-in-time snapshot. Following the trend line tells you whether the teams responsible for setting and maintaining system configurations are getting ahead of the curve.
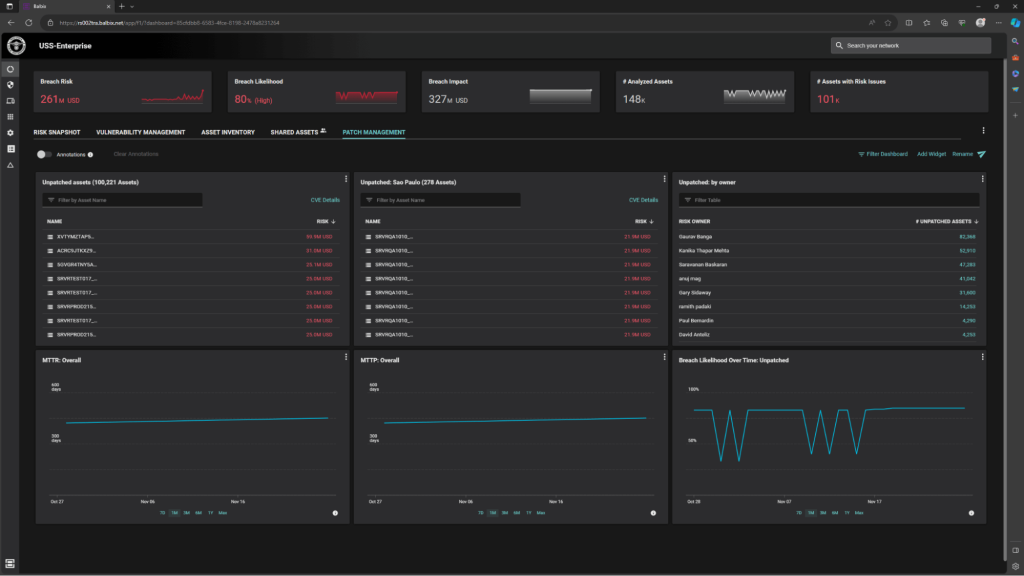
A major aspect of vulnerability management is being able to visualize the data in ways that are meaningful to the users looking at the data. To highlight that point, we’ve found that many of our users create customized dashboards that focus entirely on one specific aspect of their vulnerability management program.
For example, we have had customers create dashboards that were focused entirely on their patching programs. They have custom widgets that display information on the MTTP broken down by various regions and business units, and other dashboards that are focused on SLA’s and other aspects of the patching process.
The ability to flexibly create and share dashboards between users and teams makes it much easier to track how the vulnerability management system is performing overall without being tied to a specific view that may not include the most relevant information.
A good example of that flexibility is a Balbix customer that used the platform’s flexible widgets to display vulnerabilities that were specifically listed in CISA’s (Cybersecurity and Infrastructure Security Agency) list of Known Exploited Vulnerabilities (KEV). A snapshot here gave them a moment in time, and the ability to track trends gave them the ability to see how these high-priority vulnerabilities were being managed in their environment.
One of the metrics I didn’t include above is the commonly referenced Mean Time To Remediate (MTTR*), and there is a reason for this.
In this context, we’re specifically looking at vulnerability management – which, in many respects, is the art and science of managing vulnerability issues before they turn into incidents. Managing vulnerabilities is a facet of risk management and risk reduction. This is why tracking patching, configurations, and SLA’s are so important in this context.
In contrast with MTTP, MTTR is about remediating an incident. It measures the time required to initially detect a threat and do something about the problem. While it is a valuable metric in its own right, especially in assessing an organization’s overall security posture and how they respond, it’s less useful in the specific context of vulnerability management.
Curious how Balbix can deliver insights into how your organization’s vulnerability management program is performing? Then schedule a demo and see for yourself.
*: The “R” in MTTR is sometimes referenced as Remediate or Repair, depending on vendor context.