This is Part 2 of the blog series, Understanding Cyber Resilience. Click here to read Part 1: The 4 Stages of a Breach.
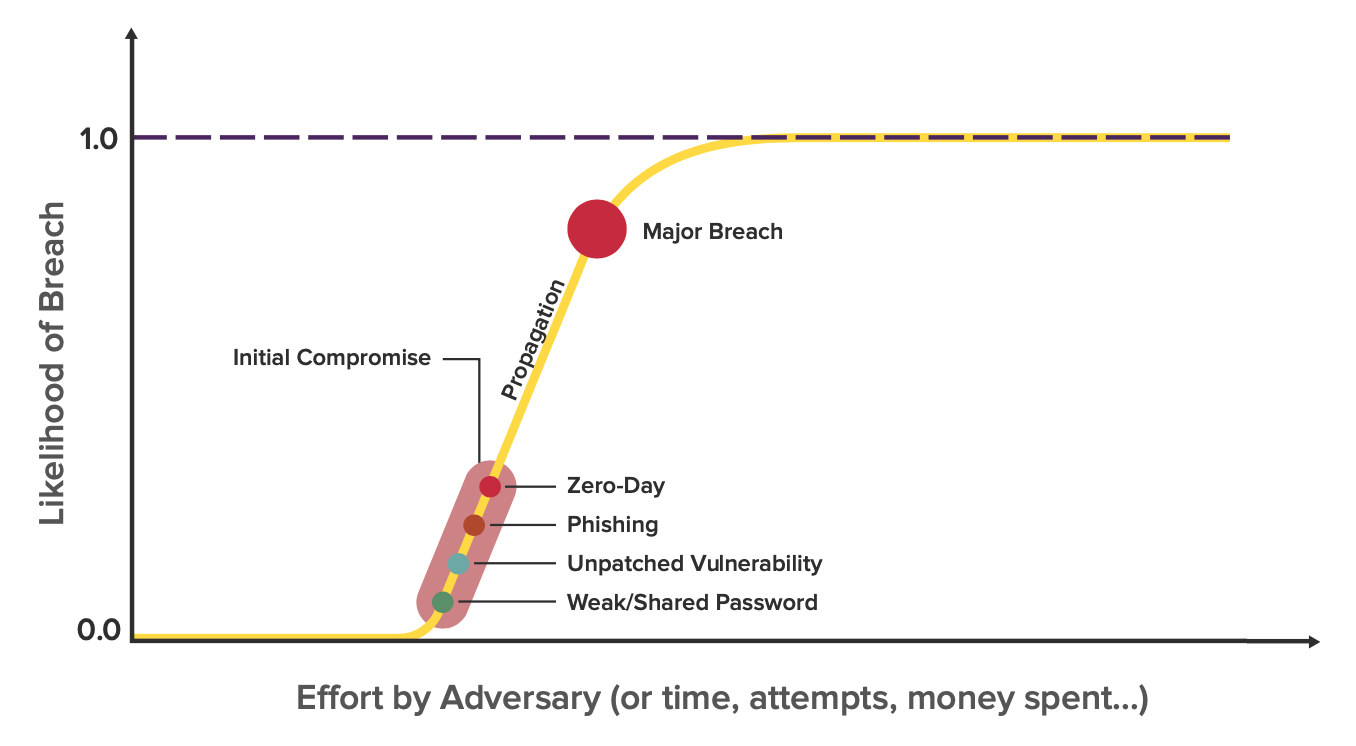
Every enterprise on this planet has a breach likelihood curve shaped like the one below.
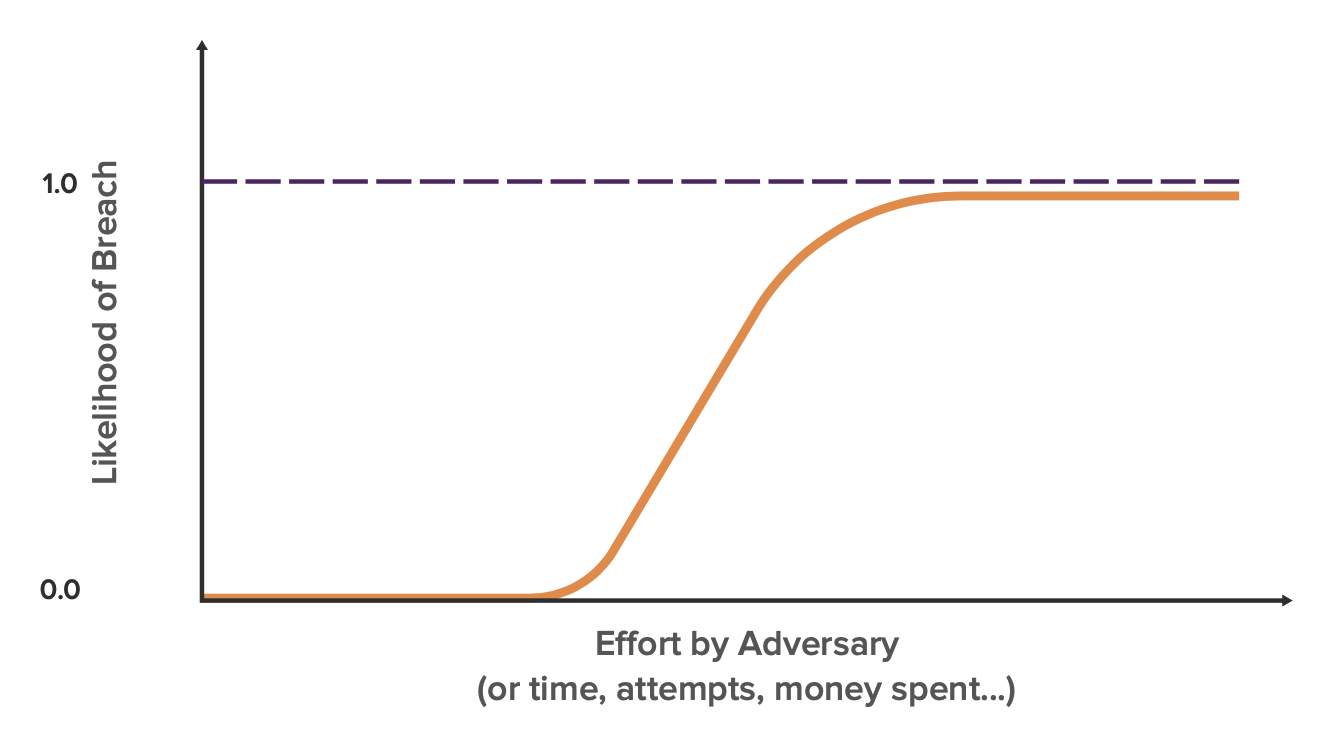
This reflects the intuitive notion all cybersecurity practitioners agree on: with enough adversarial effort, anything can be breached. How this curve differs by organization is where its knee lies in respect to effort by the adversary and the slope which represents propagation.
Security Maturity
Companies with mature cybersecurity practices, like an international bank, should have their knee on the far right of the axis. Smaller companies with less cybersecurity resources typically have a knee that is towards the left. However, as larger, more complex companies struggle to keep pace with the exploding enterprise attack surface, they too begin to shift left.
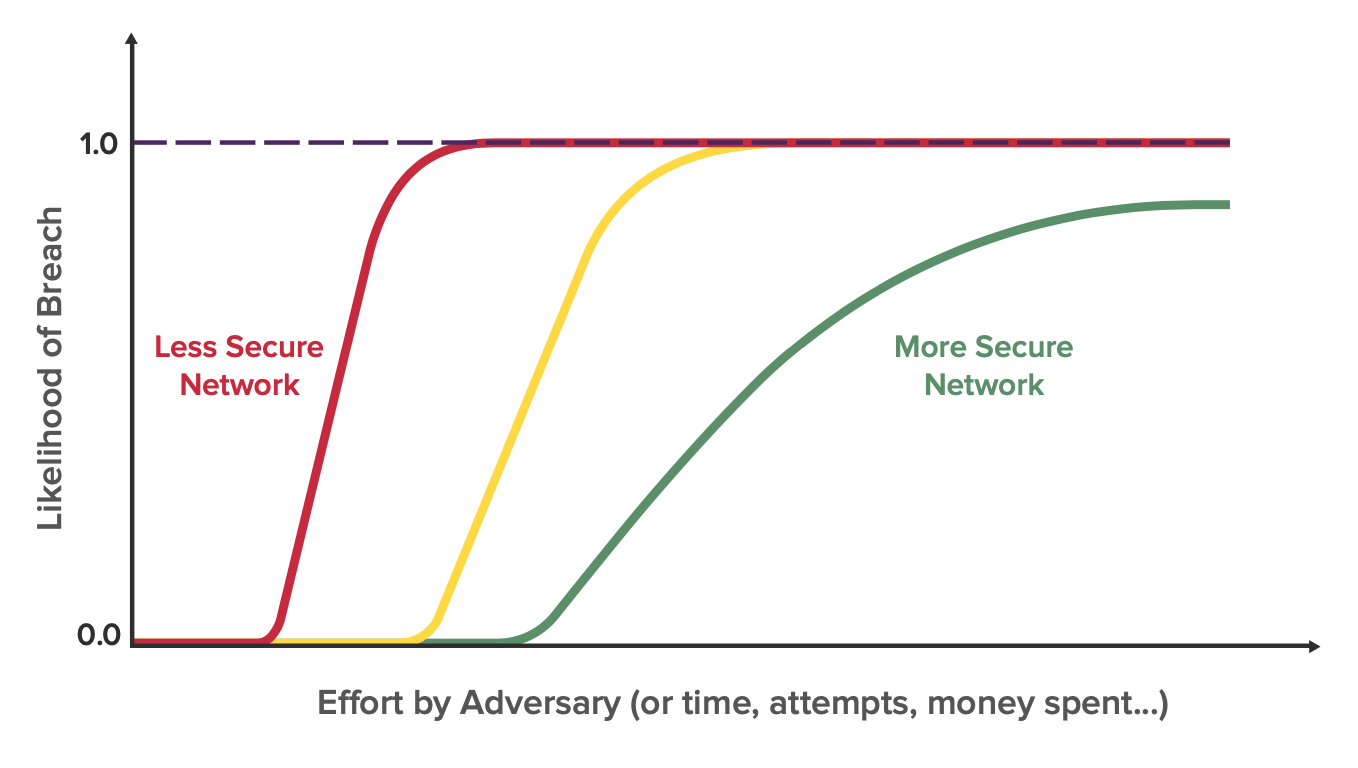
This curve is constantly in flux for organizations of all sizes as new devices and applications are added to the network and new vulnerabilities arise. Whereas these events might push the curve left, actions like the deployment of a new mitigation might push the curve to the right and decrease the slope.
Understanding the Slope
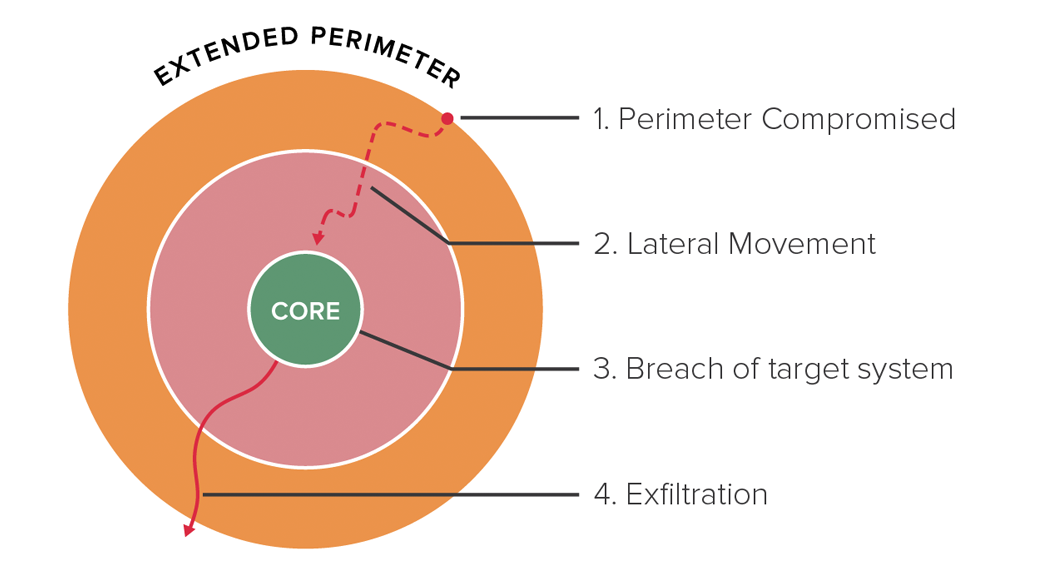
In the last blog on Understanding Cyber Resilience, we discussed the 4 stages of a breach. After the first stage of the perimeter being compromised, the bad actors are able to move swiftly from system to system. The stage of lateral movement happens much faster than the initial breach because internal access control policies and protocols are optimized for ease of collaboration and not for security. Once the hacker has a foothold on a device connected to the enterprise’s network, they can use these fast pathways that are designed to enable productivity for employees and access the target systems with speed.
Breach Risk and Impact
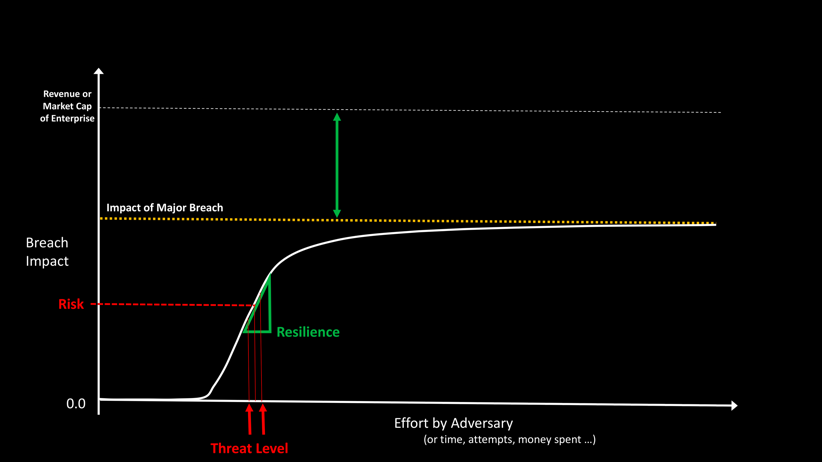
To understand cyber resilience from this curve, we can substitute out breach likelihood on the y-axis for breach impact (see image below). Breach risk is the expected breach impact at any given threat level on the curve, which is determined by the effort of the adversary.
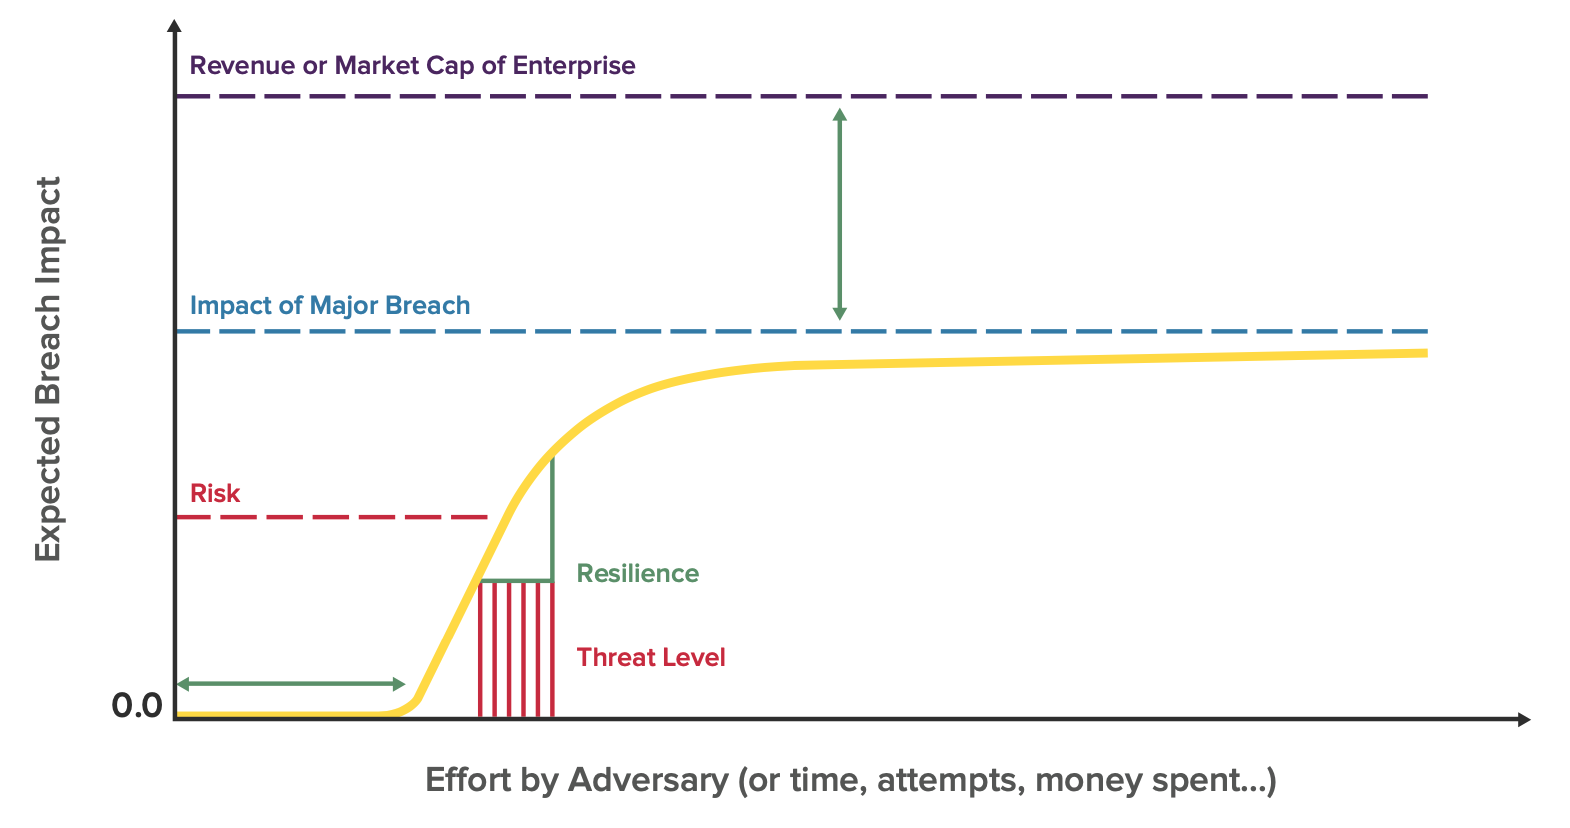
Unfortunately, it is difficult for most organizations to know exactly how much effort the adversary is putting in at any given point in time. A much more useful metric is cyber resilience, whose factors are the slope of the curve, the position of the knee, and how high the curve goes before it plateaus. An example of strong cyber resilience would be the image below, where breach risk remains low in the face of increased effort from malicious actors.
Part 3: Improving Cyber Resilience
In part 3 of this blog series, we’ll look at methods for improving cyber resilience and a 5 step plan you can take to flatten your curve.