If you are a CxO, Board Member, or in the cyber-security business, you have probably seen the word cyber resilience popping up in your conversations, news and social media feeds. To a business-person, resilience is a powerful word, and you have perhaps wondered how your organization can become more cyber resilient. If you have been around in the cyber-security business for a while, cyber-resilience might remind you of another widely-used term “defense-in-depth”.
For those who came in late: The backdrop of thinking about cyber-resilience is this- our enterprise networks contain large amounts of insecure software (and hardware) and lots of imperfect human beings– entities that fail at a fairly high frequency from a security standpoint. The enterprise attack surface is vast, constantly growing and poorly understood, and the threat landscape is constantly evolving. The objective of security teams is to implement mitigations that give us a cyber-resilient enterprise on top of insecure components. This is kinda like building a RAID array with 5 nines of availability from inexpensive and failure-prone disks.
The abstract notion of resilience is appealing of course, and relates to one of the best qualities we associate with members of the human species— our ability to succeed in the face of adversity. But how exactly does it apply to cyber-security? Is it different from defense-in-depth? How does one measure cyber-resilience for an enterprise? Or improve it?
As defined in plain English, cyber-resilience is the ability of an enterprise to limit the impact of security incidents. Cyber-resilience is not an opaque score that is derived from some simple scoring of N properties of a network. It is also not a number that you arrive at by answering a set of questions about your network. It is quite a bit more complicated than that, but can be calculated in a reasonable manner from observations of the state of your enterprise and a series of probabilistic mathematical calculations.
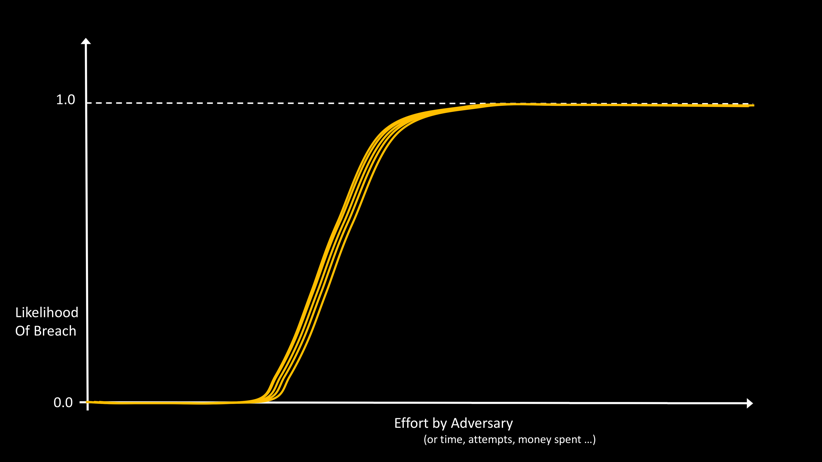
To understand the structure of cyber-resilience, let’s consider the graph in Figure 1, which plots the likelihood of breach of a typical enterprise vs effort by the adversary.
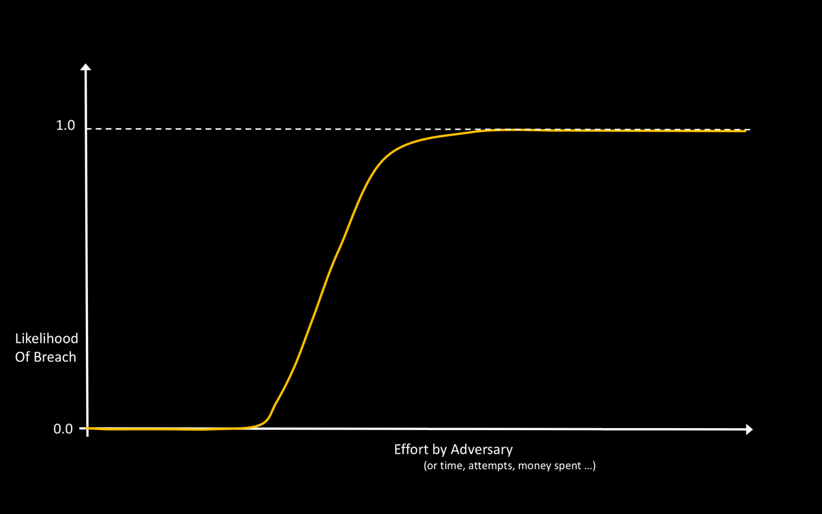
The y-axis in this picture is the likelihood of breach, a probability number between 0 and 1. The units on the x-axis are arbitrary, and could be measured in a number of different ways, for example, in terms of time spent by the adversary, or number of attempts, or money spent. (In this abstract picture and other visualizations in this article, we take some liberties with mapping multi-dimensional values and functions to 2 dimensions for the ease of understanding.)
The shape of the Likelihood vs Effort curve is consistent with one intuitive notion that all security practitioners agree with – given enough effort, anything can be breached. Every enterprise has a Breach Likelihood vs Effort curve like the one shown in Figure 1. The only difference is where the knee of the curve is on the x-axis, and the slope of the rise from 0 to 1.
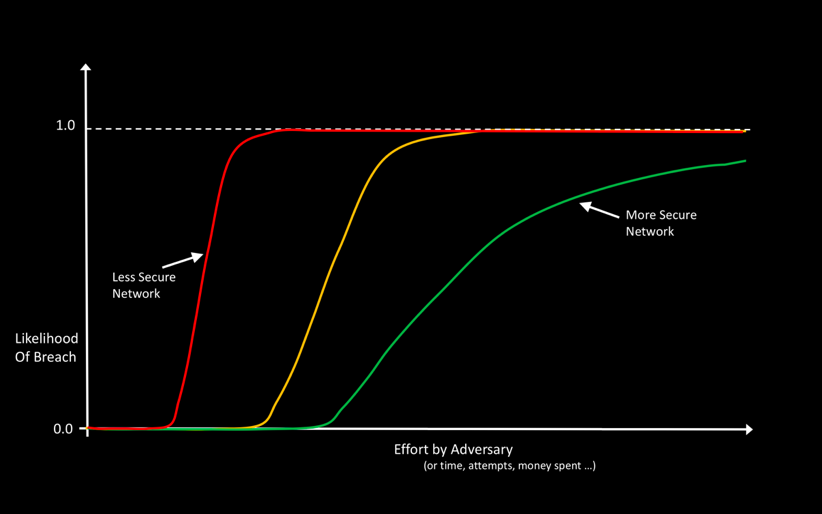
Intuitively, you might think that for networks of security-mature companies, like JP Morgan’s or Goldman Sachs’, the knee would be expected to be well towards the right of the axis. For a smaller, less security mature company, we would expect the knee to be more towards the left (Figure 2). This is largely true. But, there is also a natural entropy in play that tends to move larger, more complex networks closer to the left—everything else being the same, it is easier to break into a network with 10K moving parts than it is to break into a network with 10 moving parts.
As you might imagine, this curve is not fixed for your network for all time. As you make changes to your network, the curve changes. The deployment of a new mitigation might push the curve significantly to the right, decreasing the slope. The discovery of a new vulnerability which ends up getting used by cyber-criminals, will move the curve to the left and perhaps make it steeper, until the vulnerability is patched. Given that your network has lots of elements, and is under constant change – new devices and users, new applications, new configurations and vulnerabilities, upgrades and patches, this Likelihood vs effort curve changes on a daily basis (hopefully within a narrow range, like a guitar being played), as illustrated in Figure 3. Without loss of generality, we may assume that the leftmost curve in such a family of curves is the important one for the purposes of Risk modelling and estimations.
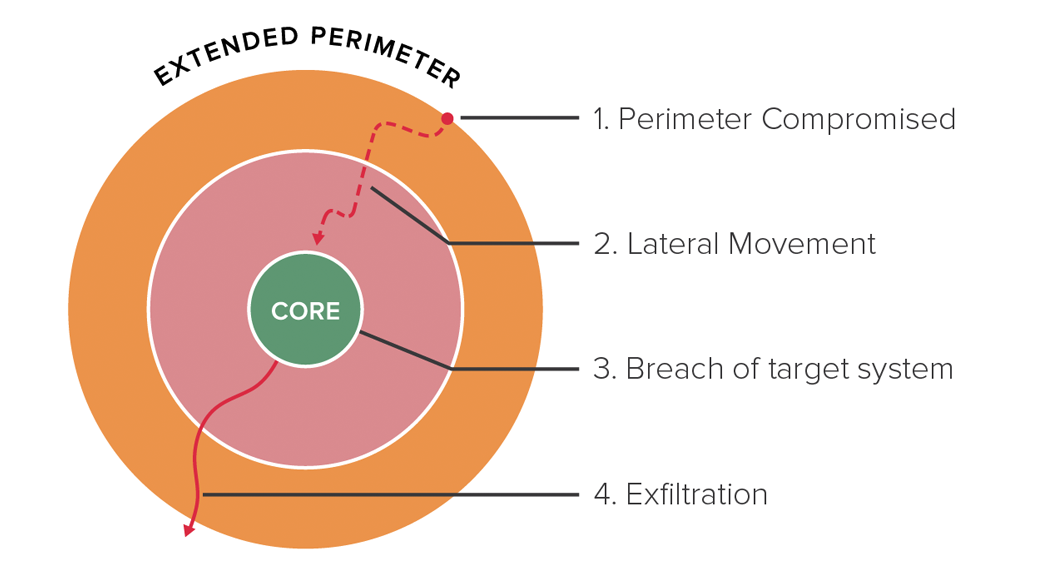
For another insight into why these curves are shaped like the way they are, consider a typical breach. A breach usually begins with one or a handful of vulnerable systems being compromised. This might happen because an employee being phished, or via a weak password for a system or application, or some unpatched vulnerability. In rare cases, the adversary may use a zero-day exploit to establish this initial beachhead. These initial compromise methods require varying degrees of effort by the adversary, as shown in Figure 4.
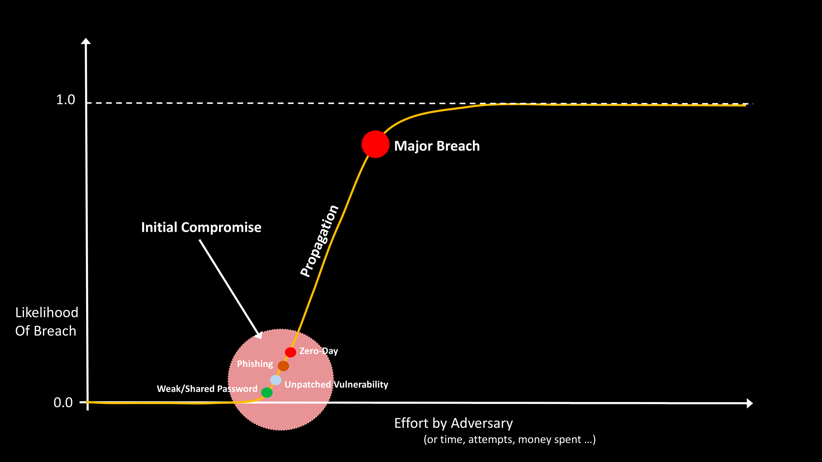
After the initial compromise, the adversary is able to jump quickly from system to system, which is why we see the sharp increase in the slope of the graph. Propagation is rapid because a fundamental design goal of our intranets is to enable ease-of-use and collaboration. Once the adversary has a beachhead on an enterprise device, they can use the fast pathways that exist inside the enterprise network to enable high productivity for the legitimate users of the compromised device.
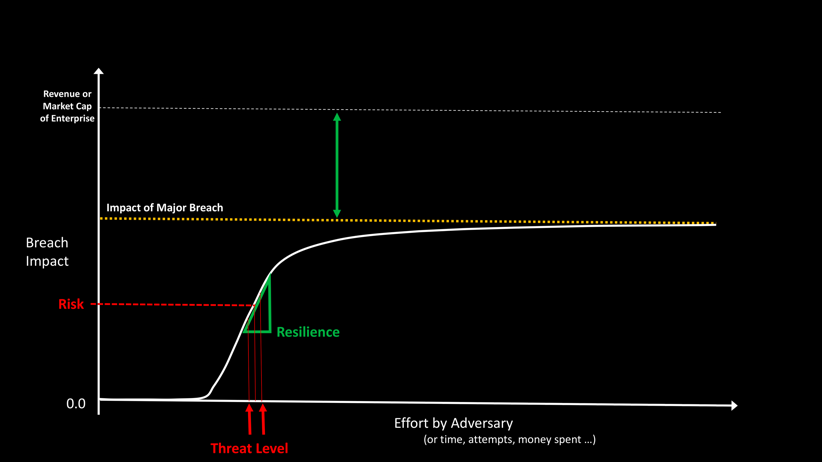
Why is the knee for a network at a certain spot? Why do some networks have a gentle slope, while others have a sharp rise from 0-1? What is exactly is my Risk from cyber breaches today? To answer these questions first let’s convert this style of plotting to Risk Math instead of Likelihood Math. You may recall that Risk = Likelihood X Impact. This is shown in Figure 5.
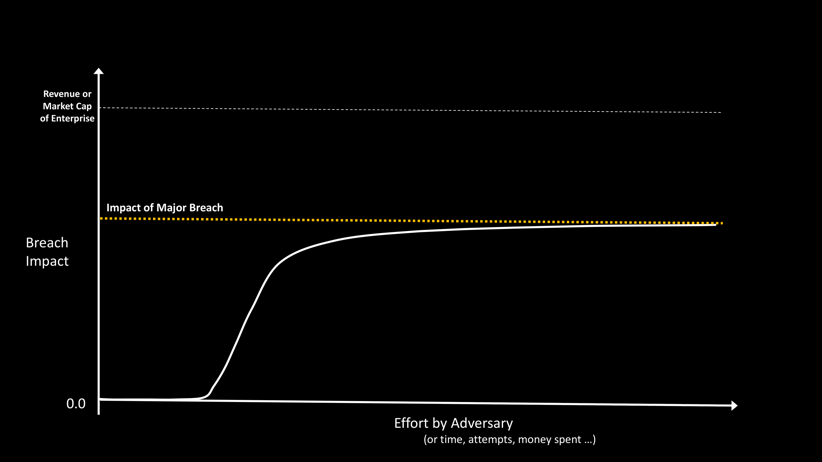
In this picture, the x-axis is the same as before- arbitrary units for effort by the adversary, measured in time, # of attempts or money spent. The y-axis is the impact of a breach. This can be expressed in dollar units, or as a fraction of the revenue or market capitalization of the organization. The shape of the curve is very similar to that of the likelihood curve. One point to note here is that impact itself has three dimensions, availability, confidentiality and integrity—and we are mapping these three vectors to a single dimension for keeping this discussion simple. Additionally, Impact is also a function of mean-time-to-repair (MTTR), and we are going to gloss over this factor for this discussion.
So, what exactly is my Breach Risk today? That depends on the threat level AND the state of my enterprise with respect to this threat level. While the threat level is very difficult to know exactly, we might be able to estimate a useful range. This is shown in Figure 6.
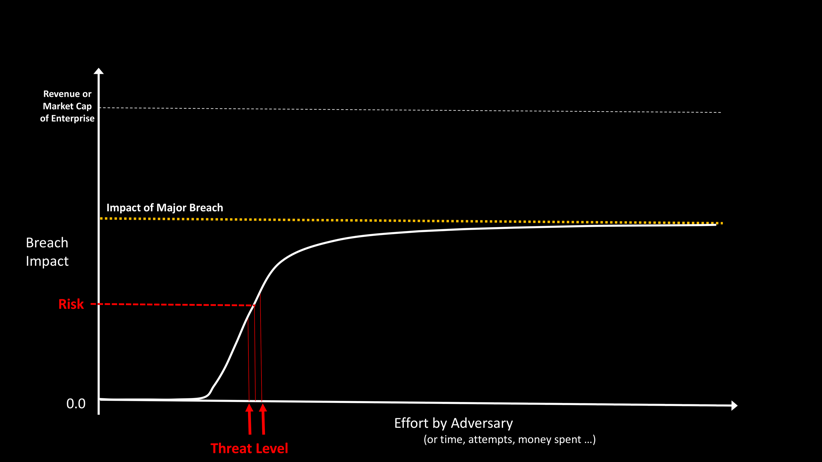
As you can see, knowing what your breach risk given the threat level is very insightful. In particular knowing whether the threat level is to the left of the knee or to the right. If the threat level is to the left of the knee, congratulations, you are good.
If the threat level is to the right of the knee, this is not so good. Perhaps the most concerning thing here is that the slope of the curve is quite sharp and it is difficult to know if the error in the risk estimation is significant— you could think you are just to the right of the knee, but a small change in the threat level or your enterprise’s state could cause you to be at high risk for a major breach.
It is for this reason that we need to consider the slope and the max value of the Breach Impact vs Effort curve, as shown in Figure 7. These two metrics are the components of Resilience. For a more secure network we want to ensure that small changes in effort by the adversary will not change the Risk significantly. We also want to ensure that the max impact of a breach is limited.
So, what does cyber resilience depend on?
As you might expect resilience depends on the configuration of your network and the mitigations you have implemented, and the effectiveness of your people and processes who are operating the mitigations.
For example, for on premise infrastructure, network segmentation, 2-factor authentication, advanced endpoint controls, using bastion hosts for network administration, ingress and egress filtering, VPNs, SoC automation all improve resilience. For cloud hosted systems, we have a similar but somewhat different list of mitigations that effect resilience. Likewise, we have different sets of mitigations that are key for impacting the resilience for each type of device, user and applications in your network. You can, in fact, consider that the curve in Figure 7 is the result of the composition of many smaller curves, one for each asset in your enterprise. Unfortunately, again, the composition is not a straight sum but a probabilistic, weighted graphical sum that depends on how your network entities depend on and interact with each other.
At this time, you are probably thinking—what is the point of this line of thinking. The Math and computation involved seems quite complex. The observations that are needed to feed into this Math would need to be gathered from all the entities in the extended enterprise network—users, assets, applications, their interactions, system and application configuration, human behavior, ACLs, mitigations, the state of all security products and intimate knowledge of the global threat model. There is no way this can be done by hand!
It turns out that it is possible to build such a system—an example of such a system is Balbix. Balbix uses hundreds of observations about indicators of risk from host, network and external vantage points funneled automatically through an AI backend to learn risk-related aspects of the network – including business impact — to build a comprehensive and predictive, bottoms-up risk model. The model presents a clear picture of which users, apps and devices drive the enterprise’s overall breach risk— see Figure 8, for an example.
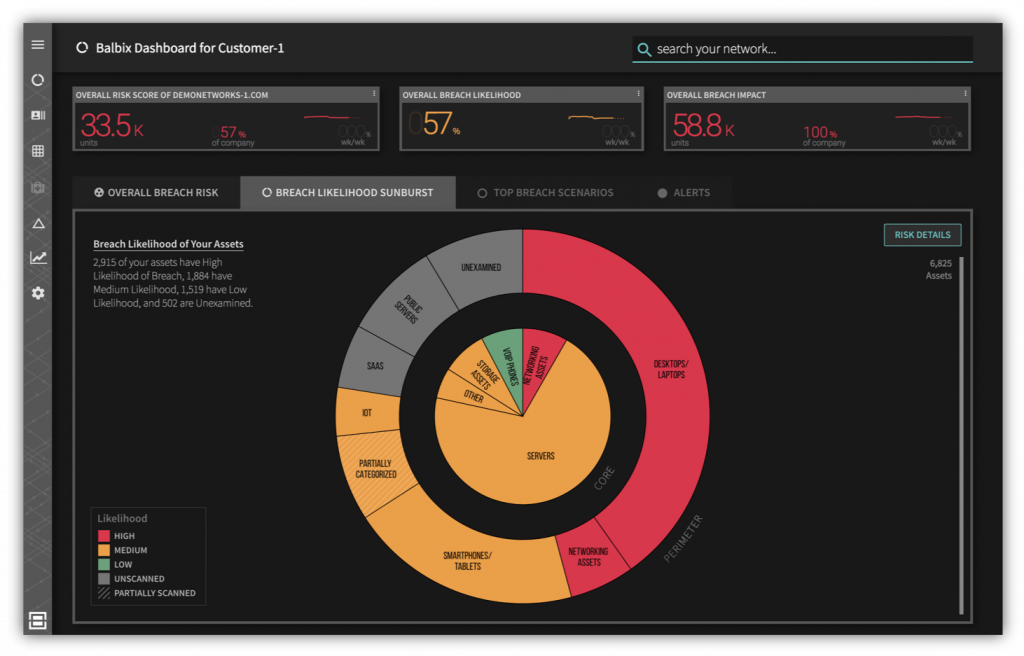
The Balbix system can predict critical breach scenarios, help users prioritize security operations and projects, prescribe specific mitigations and best practices, and ultimately improve cyber resilience.
Originally published Aug 22, 2017, updated June 02 2020